Surface modeling by points |


|
|
The mode is intended for creating quality matrices based on indicators and isoline maps based on the constructed matrices. Matrices and isoline maps can be created both for the entire region and for a selected areal object.
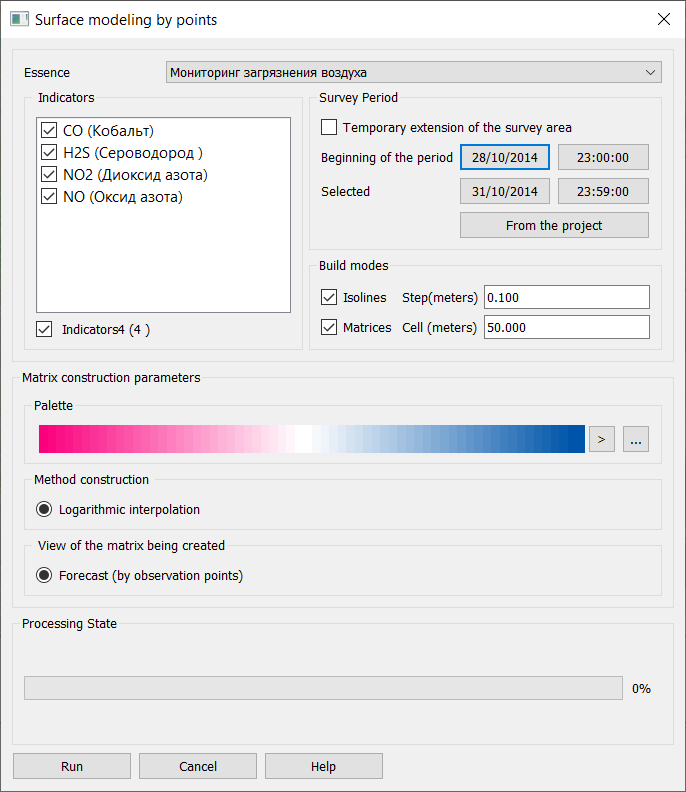
Before creating matrices and maps, customize the form: — Entity – select one of the project's entities from the drop-down list; — Indicators – in the list, select those indicators based on which you want to build matrices and maps. The indicators of the selected entity are displayed in the list. For each indicator, settings are saved individually. The number of selected indicators for all entities is shown below the list. Also under the list there is a control element that allows you to select or reset all indicators in the list; — Temporary extension of the survey area - if this control is disabled, then the matrices are built for the time period specified in the project. In this case, the data for each matrix is selected according to the following time frames – (D1, D1+dT), (D1+dT, D1+2*dT), ... , (n*dT, D2), where D1 is the start time of the project, D2 – project completion time, dT – step size on the project time scale. When you enable the control element, it becomes possible to manually set the time interval for constructing matrices and isoline maps. In this case, the data for each matrix is selected as follows – (d1, d1+dT), (d1, d1+2*dT), ... , (d1, d2), where d1 is the selected beginning of the construction time interval, d2 is the selected end of the construction time interval, dT – step size on the project's time scale. When you click on the From the project button, the selected start and end of the time interval take the values of the start and end time of the project; — Matrix cell sizes (m.) – set the matrix cell size in meters. The smaller the size, the more accurate the created matrix will be, but the time to construct one matrix will increase; — Method construction – select the method of constructing matrices – logarithmic interpolation or weighted average interpolation over a network of triangles; — View of the matrix being created – the type of matrix is selected – forecast (by observation points), predictive generalized (along the contour of an area object) and interpolation (by subobjects of an area object). If an area object was not selected before calling the dialog, then only the first type of the matrix being created will be available; — Step for constructing isolines – set the step for constructing isolines. It is available if the Build isolines control has been enabled. — Click the Run button after finishing the form setup to start the plotting process. In the process of constructing matrices and isoline maps, the processing status for each matrix will be displayed, and it will be indicated which indicator is currently being processed and for what time interval this or that matrix is being built. — The program provides the ability to process survey rounds taking into account their chronology and territorial reference. In the process of streaming data processing to construct matrices at the current point in time, the program selects only those points that have measurements at the specified point in time. Most often, such points are compactly located in those areas of the terrain where the survey was carried out. To exclude from the construction area the territories that are not provided with measurement points, the settings from the View of the matrix being created group are applied. — If you need to limit the construction area, use an area object that indicates the boundaries of the construction. If you need to limit the construction area by several sections, use an area object with subobjects. For the view of matrix being created the «interpolation» a construction is carried out only inside subobjects. At the same time, a check is made to ensure that the inspection points fall inside the subobject.
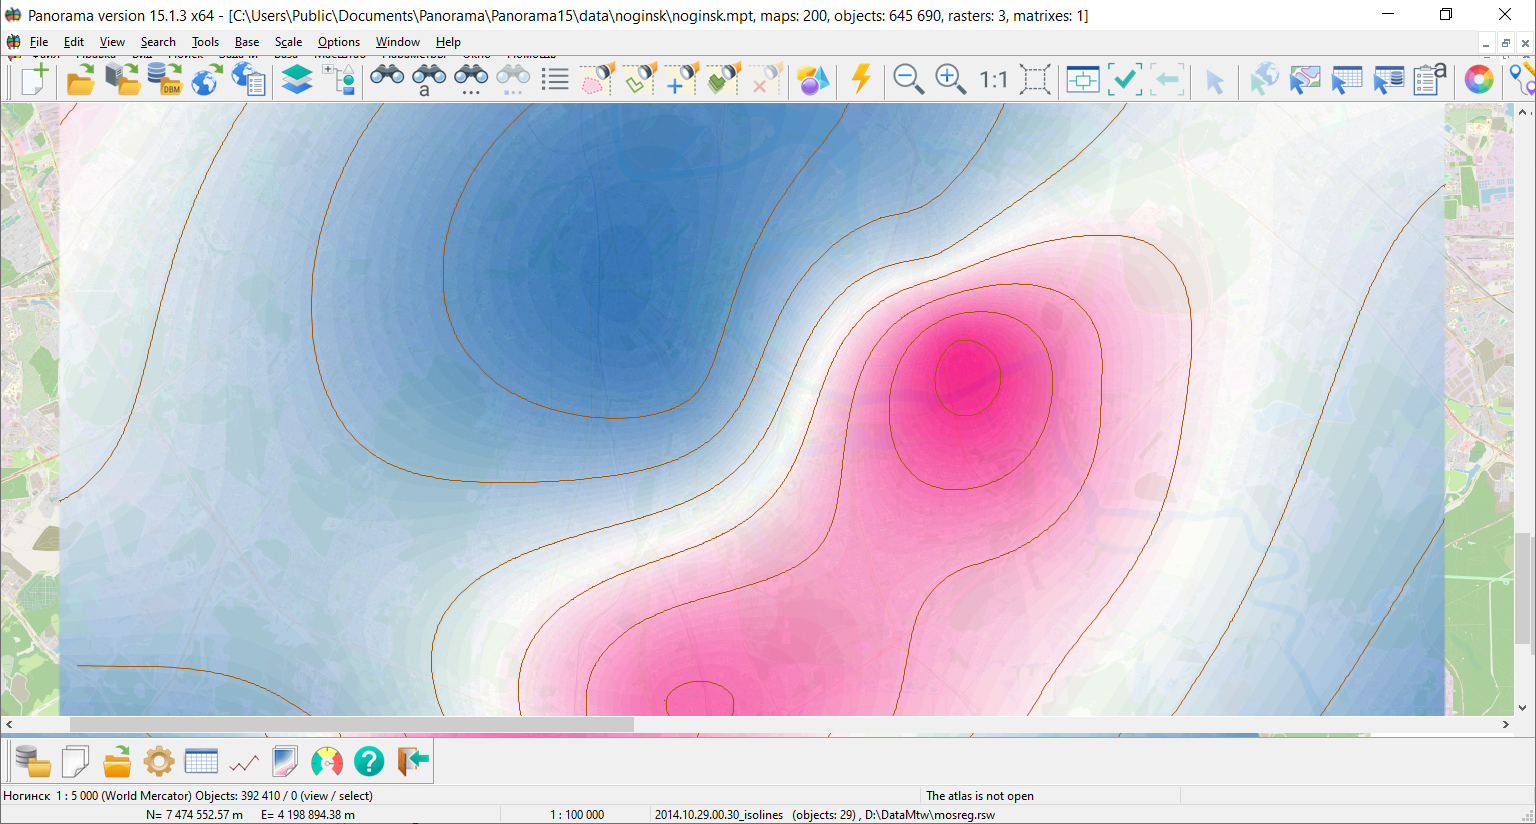
The result of constructing a matrix of quality according to the indicator:
|


