Charts and graphs of the project |


|
|
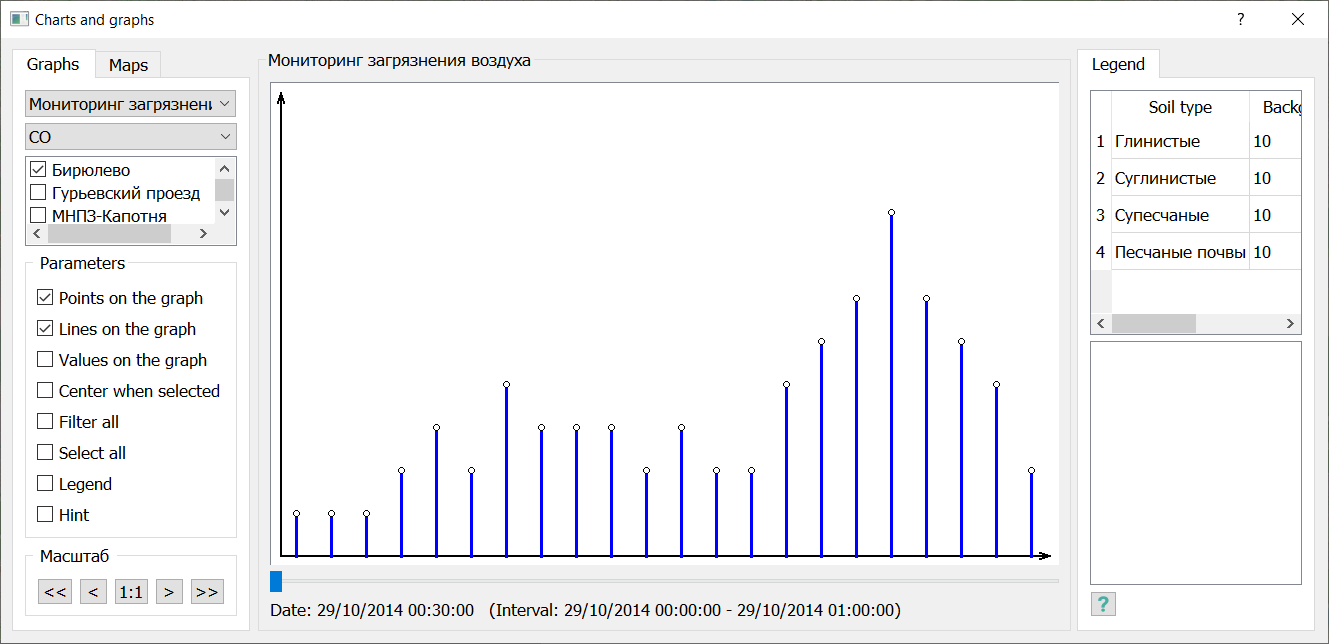
There are two types of graphs available: linear and columnar. A linear graph displays changes in the value of an indicator, which can be recorded at any point in time – continuous observations. A columnar graph displays monitoring indicators that are discrete events. Discrete events include earthquakes, landslides, emissions of harmful substances into the atmosphere as a result of technological accidents, and so on. A discrete event is characterized by the maximum value of the recorded indicator. Linear and columnar graphs are displayed together on a single time scale. The height of the bar graph corresponds to the value of the indicator, and its position indicates the moment in time when it occurred. To view graphs of changes in monitoring indicators, the program provides a corresponding form. To control the composition and appearance of graphs, there are elements in the data management frame on the left side of the form.
The following elements are used to manage the composition of graphs: — Composition of observation points.
Graph display settings, including: — Points on the graph, — Values on the graph, — Legend, — Hint.
The established composition of observation points corresponds to the composition of graphs. For a complete composition of graphs, sequentially view all entities and all indicators and set only the composition that interests you. With the checkbox Points on the graph checked, the line graphs display the points corresponding to the measured value of the indicator at a specific point in time. With the checkbox Values on graph checked, indicator values are displayed as labels for linear and columnar graphs. With the checkbox Hint checked, use the mouse to hover over the graph of interest and the program will display the name of the observation point and the value of the indicator for the analyzed point in time. To increase or decrease the image of graphs, use the buttons of the Scale group. |