Exceeding the background concentration |


|
|
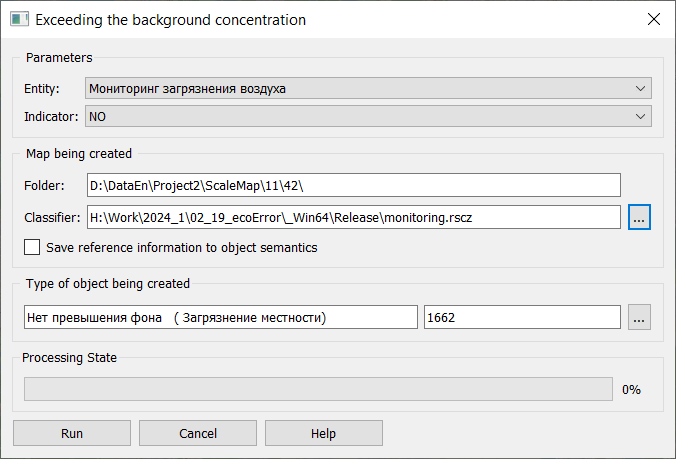
To calculate the excess of the background concentration, a dialog of the same name is intended, which provides the construction of time series of data with information about the excess of the background concentration for the selected indicator. The initial information for construction is the time series of matrices of individual monitoring indicators and the maximum permissible concentrations (MPC) of their values.
The result of streaming data processing is a time series of isoline maps characterizing the excess of the MPC. Before constructing time series of maps, customize the form: — Entity – select one of the project entities from the drop-down list; — Indicator – select an indicator from the drop-down list. The list displays the indicators of the selected entity; — Classifier – select a classifier file that will be used to construct maps of excess of background concentration; — Save reference information to object semantics – enable this control if additional reference information needs to be added to the semantics of objects plotted on the maps of the created time series.; — Type of object being created – allows you to select from the classifier the type of objects put onto the maps of the time series being created. After customizing the form, click the Run button to start building. In the process of map construction the construction status will be displayed in percent for each map. Formation of values of excess of background concentration in the form of isoline maps allows you to analyze them together with time series of matrices of monitoring indicators.
|