Scenario for constructing a map of favorable areas |


|
|
The map construction takes into account the presence of objects of interest (residential buildings) and environmental impact factors, as well as the distance of objects of interest from environmental objects.
Objects with negative factors include those (areas) that worsen: — safety (Nuclear/Chemical Industry Plant, Nuclear Power Plant, Gas Station, Gas Infrastructure Facilities, Gasified Houses); — noise levels (Construction Sites, Railway Tracks, Runways, Helicopter Pads, Major Highways, Stadiums); — air quality (Landfills, Livestock Farms, Smoke Stacks); — mood (Industrial Enterprises, Electrical Substations, Heat and Power Plants, Quarries, Cemeteries, Crematoriums, Marshy Areas).
Objects with positive factors include those (areas) that improve: — the quality of the urban environment (Theater, Cinema, Sports Ground, Swimming Pool); — mood (Forest, River, Water Body).
Each object is assigned an influence radius (in meters) on neighboring objects. For example, a major highway is assigned a radius of 1000 m, a railway track — 500 m, and a landfill — 3000 m. For objects of smaller length and area, the influence radius is reduced.
To construct the map of favorable areas, the classifier monitoring.rscz is used, which has been enhanced with semantics containing codes for recording impact factors. The map is created in the form of a hexagonal grid covering the entire territory of the map or based on selected objects (administrative divisions). The grid consists of a set of area-based hexagonal objects containing semantics with the impact factors of neighboring objects.
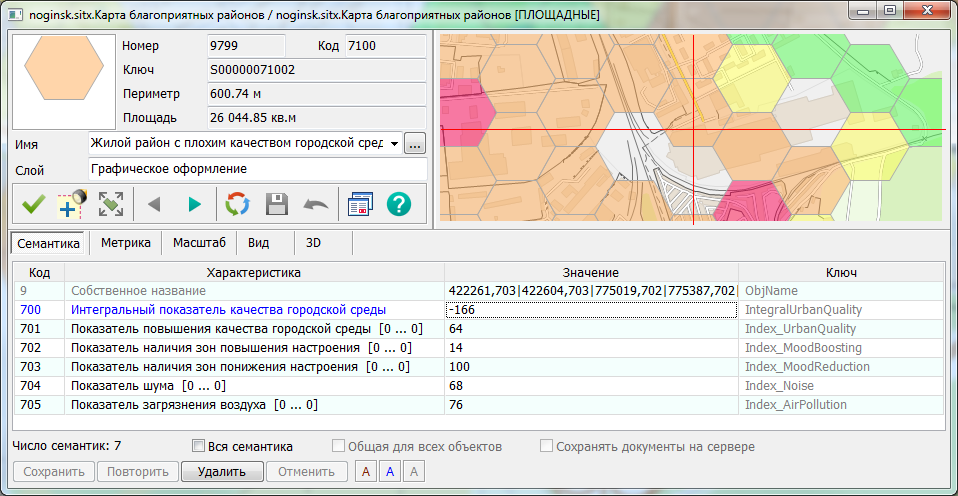
In each cell of the grid, information about surrounding objects, positive and negative impact factors, and the degree of influence of these factors (from 0 to 100 percent) is recorded.
The values of the factors are stored in the corresponding semantics: — Indicator of urban environment quality improvement (701); — Indicator of the presence of mood-enhancing zones (702); — Indicator of the presence of mood-depressing zones (703); — Noise level indicator (704); — Air pollution indicator (705); — Fire hazard indicator (706); — Indicator of the presence of flood zones (707); — Indicator of the presence of areas dangerous for living (708).
When a grid cell is recorded on the map, the semantics of the Integral urban environment quality indicator (700) is automatically created. The value of this semantics is calculated using the formula: #701(0) + #702(0) - #703(0) - #704(0) - #705(0) - #706(0) - #707(0) - #708(0).
Grid cells are recorded as objects series from the Residential area (code 7100), and the type of object depends on the value of the semantics of the Integral urban environment quality indicator (code 700):
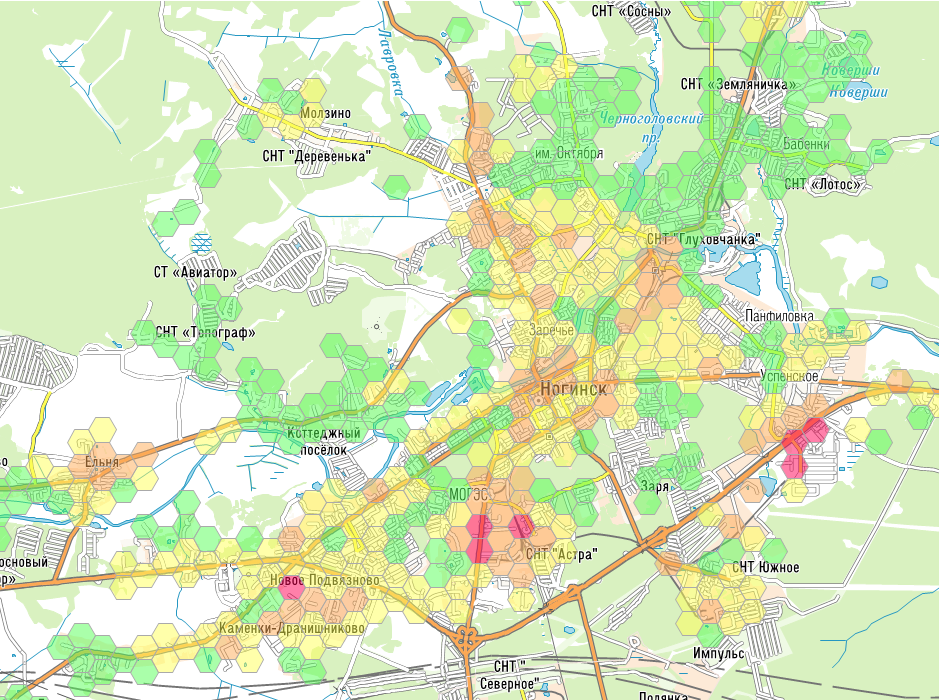
When positive influencing factors prevail, the cells are colored green or blue. When negative factors prevail, the colors are yellow, orange, or red. In the absence of indicators, the color is yellow. The illustration shows a map of favorable areas constructed based on the OSM map.
When creating a thematic map (to minimize distortions of hexagons) for an area that contains more than one 6-degree zone, it is necessary to perform the construction for each zone with its own parameters (axial meridian and main parallel). The axial meridian and main parallel are determined as the average values of the angular dimensions of the area used to construct the network.
The hexagonal network is constructed based on the map located in the folder: c:\Users\Public\Documents\Panorama\Panorama15\data\noginsk\map\noginsk.sitx |


