Color palette of a map |


|
|
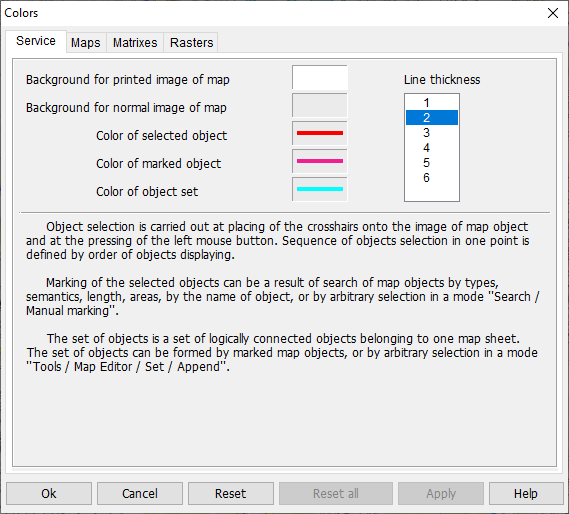
Color palette dialog includes following panels: — service; — map; — matrix; — raster.
Service palette used to set: — colors of map background; — colors of selected objects; — colors of marked objects; — line thickness of selected or marked object.
The change of colour is carried out left button click on rectangular area appropriate to the necessary mode (a background color of a map, colour of the selected object, colour of the marked objects). After pressing the above circumscribed rectangular area the standard dialog of colours choice will be actuated, in which it is necessary to set new colour. Line thickness of the selected or marked object varies after selection of string inclusive necessary digit. A range of line thickness change is from 1 up to 6.
Attention! Reset button in a Service bookmark restores in an inital state: — background color of a map; — colour of selected object; — colour of marked objects; — line thickness of the selected or marked object; — value of brightness and contrastness of map color palette; — color palette of a map; — value of brightness and contrastness of matrix color palette; — color palette of a matrix; — value of brightness and contrastness of raster color palette; — color palette of a raster.
After confirmation of the fulfilled customizations by pressing OK button all changes are saved. In the subsequent sessions Panorama boots with the saved customizations and changed color palettes of a map, matrix and rasters.
Map palette Before set-up of the color palette set a name of an edited map, since a user map can be added to a map document. The name of an edited map is selected from a drop-down list of maps. The color palette of a selected map is displayed in the left part of the dialog. The replacement of colours is carried out left button click on an appropriate unit of the color palette. After pressing a unit of the color palette the standard dialog of colours choice will be actuated, in which it is necessary to point new colour. The bars of brightness and contrastness use for change of displaying intensity of map color palette. By driving of a movable indicator to the left or to the right it is possible to reduce and to increase brightness and contrastness. By left button click on a colour rectangle in a structure of the color palette it is possible to change the initial colour on desirable. The new colour is selected by using of the standard dialog Choice of colour.
Reset button in a Map bookmark restores in a reset state: — Value of brightness and contrastness of the color palette of a map; — color palette of a map.
Controlling the Matrix Palette
The matrix palette defines a view of displaying all matrixes of elevations added into the document.
The control of the matrix palette includes: — customizing diapasons of displayed elevations, — customizing of palette colors; — customizing of brightness, contrast and shadows types, — choosing a palette of matrix of elevations from a project file *.mpt by the button «…», — call of the advanced dialog of customizing a matrix palette by the button «>>».
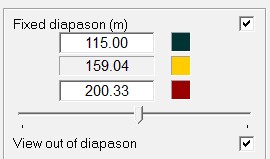
Customizing a range of displayed elevations is carried out in the Fixed diapason group.
The group contains: — window of displaying and editing the minimum elevation of diapason (upper window), — window of displaying and editing the maximum elevation of diapason (lower window), — window of displaying the intermediate elevation of diapason (middle window), corresponding to position of the ruler slider, — ruler with a position slider of intermediate color of two-interval palette, — windows for specifying the modes «Fixed diapason» and «View out of diapason».
If the «Fixed diapason» mode is not used, the diapason of displayed heights is dynamic, i.e. its borders (the minimal and maximal height) vary at addition of a matrix into the document and removal of a matrix from the document. If the user changes borders of diapason in windows of the minimum/maximum elevations or uses the «Fixed diapason» mode, then the boundary elevations of a diapason are fixed. Thus, addition of matrixes of elevations into the document and removal of matrixes from the document does not influence boundary elevations of diapason. For return to a dynamic diapason of matrixes it is necessary to press the Reset button. If the mode «View out of diapason» is not enabled, the elements of the matrix with elevations outside the range are not displayed. If the mode «View out of diapason» is enabled, then the elements of the matrix with elevations greater than the maximum are displayed with the last color of the palette, and the elements of the matrix with elevations less than the minimum are displayed with the first color of the palette.
To customize the colors of the palette, the following dialog elements are intended: — list of Palette; — Colors number edited field; — an edited field the Colors number; — boundary colors of two—interval palette corresponding to windows of the minimum, maximum, average elevation of group the Fixed range; — ruler with a slider of position of the intermediate color of two-interval palette; — rulers of brightness and contrast.
After starting of Colors dialog the Palette list contains the following positions: — Initial; — Standard; — Gray.
At customizing the colors of palette to the listed positions of the list the Current line will be added. For return to a palette status at the moment of starting of Colors dialog it is necessary to choose Initial position of the list. At customizing the colors there is an opportunity to set two-interval palette in forming of which three colors participate: initial, intermediate and final. For change of initial, intermediate and final color it is necessary to choose the corresponding rectangle by clicking the left mouse button. Position of intermediate border of color intervals is set by the ruler's slider, thus, the height corresponding to the intermediate color is displayed in the middle window. The matrix palette is displayed on the left side of the dialog. To change the colors, click the left mouse button on the corresponding palette element. After clicking on the element of the palette, the standard color selection dialog is activated, in which you must specify a new color. Rulers of brightness and contrast serve to change the intensity of the display of the matrix palette. Moving the slider to the left or to the right can reduce or increase brightness and contrast. Pressing the Reset button in Matrix Colors bookmark provokes transition to a standard color palette, the number of colors is set equal to 32, the sliders of rulers of brightness, contrast and the slider of intermediate border of color intervals are set to the middle position. If the range of user's heights has been earlier set, it varies onto the common diapason of matrixes. For tuning shadows view it is necessary to choose a required item of the Shadows type list.
Raster palette Before set-up of the color palette set a name of an edited raster, since some raster maps can be added to the document. The name of an edited raster is selected from a drop-down list of rasters. The color palette of a selected raster is displayed in the left part of the dialog. The replacement of colours is carried out left button click on an appropriate unit of the color palette. After pressing a unit of the color palette the standard dialog of colours choice will be actuated, in which it is necessary to point new colour. After confirmation of changed colours (pressing OK button of the dialog Colors) color palette of a raster stay in the memory, and changed color palette is saved in the service file once Panorama session is over. In the subsequent sessions Panorama boots with the saved customizations and changed color palette of a raster. For returning of the raster color palette into inital state press Reset button.
The bars of brightness and contrastness use for change of displaying intensity of raster color palette By driving of a movable indicator to the left or to the right it is possible to reduce and to increase brightness and contrastness.
The button restores Reset in a bookmark Handle of the color palette of a raster in a reset state: — Value of brightness and contrastness of the color palette of a raster; — Color palette of a raster (the color palette boots from the raster file, inste ad of from the service file).
Rasters, downloaded from the TIF-enabled mode, «Do not copy the original image in RSW» can be displayed in a coordinate system different from the coordinates of the raster. In this case for acceleration of displaying the recalculation of coordinates from coordinates system of a raster into coordinates system of displaying is performed according to strict formulas only in grid nodes. The pixels located inside of a cell are recalculated by the simplified formulas of affine transformation. To operate the size of a cell it is possible having set its radius in pixels of the screen in parameter «Radius of a cell» of group «Drawing TIF-raster». Increasing the size of cells increases the speed of displaying. But in case the system of coordinates of displaying is considerably deformed concerning system of coordinates of a raster, on the image of a raster the cells become visible, inside of which recalculation of coordinates is performed in a linear fashion. Therefore it is recommended to select the minimal value of radius at which acceptable speed of displaying is provided. Because this option depends primarily on the performance of your computer, cell size is a global parameter. That is, it is used to display all TIF rasters since its installation.
For the palette of raster images of images and geoportals the «Saturation» parameter with a range of values from —16 to 16. For the initial state of the palette, the value 0 is taken. Increasing the value increases chromaticity of the image (degree of difference from gray color). Increasing the image chromaticity allows you to improve the quality of visual interpretation. Decreasing the value decreases the image chromaticity. At minimum value, the raster image becomes gray halftone. Decreasing the image chromaticity allows to prepare it as a background image. The background image can be used for drawing applied objects of the user map.
|


