Controlling the displaying by histogram |


|
|
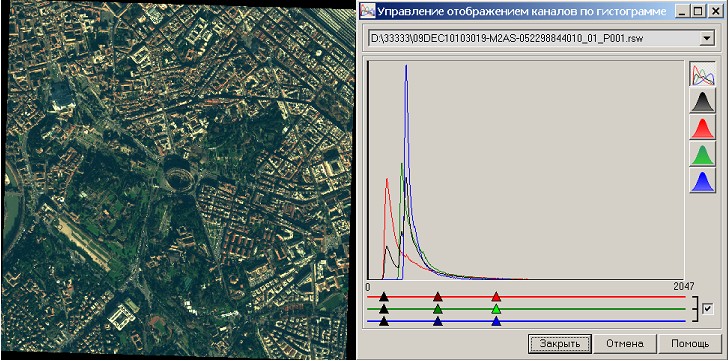
At starting the dialog a histogram of distribution of brightness (for the panchromatic raster) or the intensity of the RGB color components (for color and multispectral images) is shown. The histogram is needed in order to determine which part of the colors range can be stretched onto the entire visible range with a minimum loss of information. To increase the contrast, it is necessary to set the extreme sliders on the edges of histogram spikes. The smaller distance between the extreme sliders will be, the greater will be the contrast. But at a significant decrease of the range of converted colors the informative colors will start to be lost. Changing the position of the average slider it is possible to change the brightness of a raster in addition to the contrast. By default, changing the sliders position for all visible channels occurs simultaneously to avoid color's distortion. If you disable the checkmark linking the channels, then you can change the contrast and brightness of each channel separately. In this case, you can achieve even greater increase of contrast. By calling the dialog in a mode of fine-tuning of display in the chosen area the histogram is shown for the chosen area of a raster. In this mode it is possible to achieve optimum display of the chosen area. But when moving the displaying window relative to the area for which the tuning was made, a significant deterioration of the image quality is possible. This is due to the fact that insignificant colors outside the selected range are equalised (smaller than minimum are equal to 0, more than maximum are equal to 255). And at the new position of the displaying window the previously insignificant colors become necessary to distinguish between parts of the image. It usually occurs at a significant change of average brightness in a window. The distribution curve of colors can be shown in the form of classical histogram for each channel or joint set of linear graphs. Black color shows the average histogram calculated by the averaging of histograms for all visible channels. At change of a current raster the histogram of a new raster is shown and sliders are set in accordance with its settings. The status of the previous edited raster remains the same as it was in the time of changing the current raster. To return the status of all modified rasters, press the button «Cancel». To confirm all the changes, click the «Close» button. |