Brightness histogram for channels |


|
|
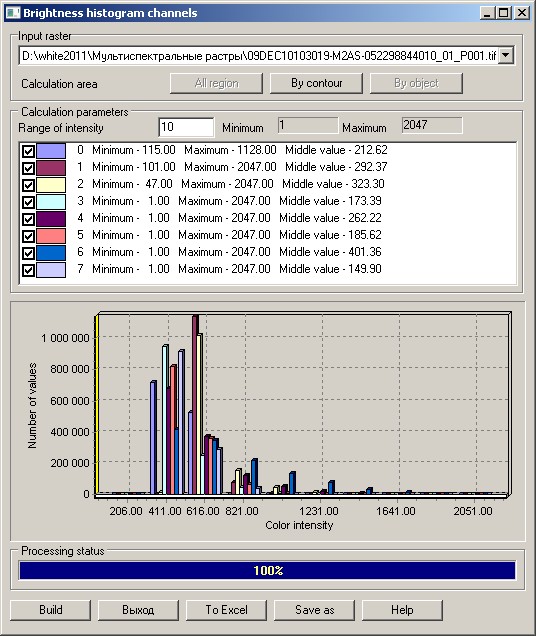
Range of intensity field is intended for entering by the user the number that determines the number of groups (classes) for calculating the quantity of values. The minimal and maximal value of intensity for each channel is displayed in corresponding windows. In the table with the list of channels it is possible to operate display and color of each channel. To disable displaying the histogram of any channel, it is necessary to remove "tick" opposite to number of the channel. Colors of channels are specified arbitrarily. For change of color of the channel it is necessary to call standard dialog of a color selection by double clicking the mouse on a window with color of the channel.
Dialog «Brightness histogram»:
To build the histogram it is possible by clicking Execute button. After change of a range, disabling displaying the channel or change of color it is necessary to press Execute button. The mode carries out saving the histogram and statistical data into Excel at an execution of the button To Excel. For calculation of statistics for object the vector map with the polygonal or closed linear object should be added to a raster. Save as button is intended for saving the image in files BMP, WMF, EMF with the specified name. |