Spectral properties of image |


|
|
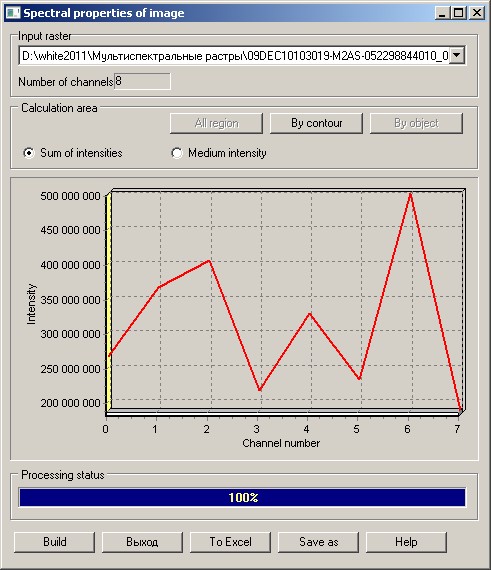
The result is displayed in the form of a graph, where on axis X is the number of the channel, on axes Y - the sum of the intensities or average intensity.
Dialog «Spectral properties of image»:
To calculate statistics it is possible by clicking Execute button. The mode carries out saving the graph and statistical data into Excel at an execution of the button To Excel. For calculation of statistics for object the vector map with the polygonal or closed linear object should be added to a raster. Save as button is intended for saving the image in files BMP, WMF, EMF with the specified name.
|