Data Tab |

|
|
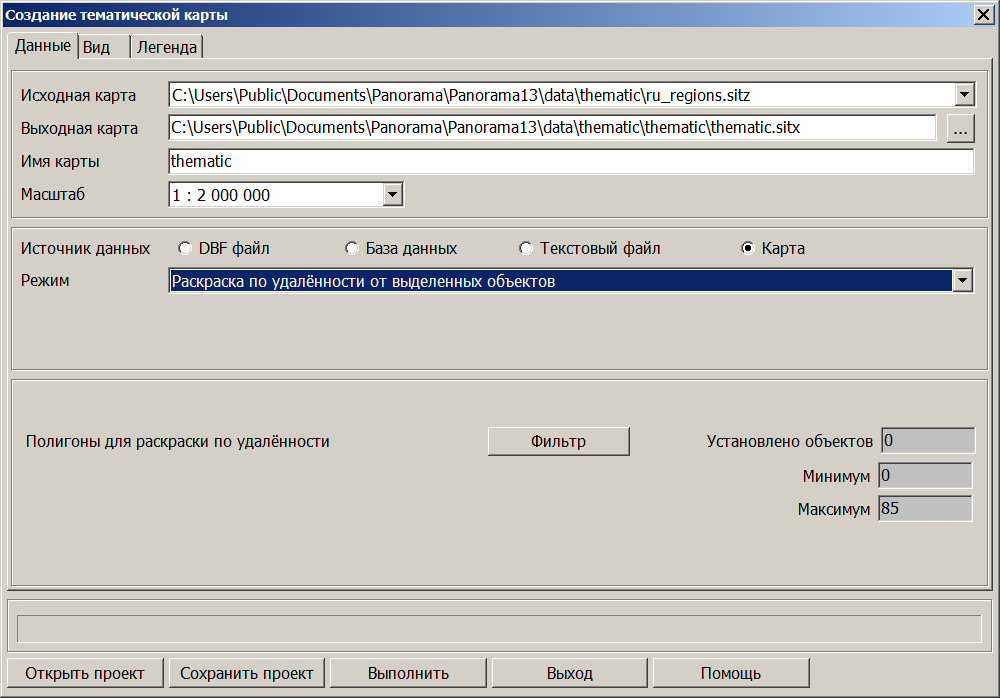
The source data for creating a thematic map is an electronic map with highlighted objects. If the current document contains multiple maps (map background and user maps), you should choose which one to process. The resulting map will be created with the name you specify. During its creation, the classifier used to create the processed map will be used. The data sources for building a thematic map can be databases, text files (TXT and CSV), and the map itself. For databases, the connection with selected map objects can be of two types: internal connection (via LINKOBJECT table field) and conditional connection (table field <-> object semantics). For text files, the connection is conditional (table field <-> object semantics).
For maps, there is no table connection; information is extracted from the semantics of selected objects or calculated.
When building from a map, six modes are available: — coloring by semantic values, — coloring by ordinal number, — random coloring, — coloring by number of objects, — coloring by distance from selected objects, — coloring by unique semantic values.
The connection between selected map objects and open database records (building modes) can be of eight types:
1. Coloring by semantic values. Selected map objects are colored according to semantic values. The characteristic to be used in building cartograms should be specified in the Values Field list. The Values Field list contains the names of semantics found in selected objects. This mode allows building for semantic types: numerical value and value as a numerical code from the value classifier.
2. Internal connection (via LINKOBJECT table field) Objects are connected to the table through internal table connections. For establishing connection, the table must contain the LINKOBJECT field, which contains map object numbers. Selected objects' semantics are not involved in the connection.
3. Conditional connection (table field <-> object semantics) Objects are connected to the table by identifying the semantic value selected from the list of selected objects' semantics and the table field selected from the connection fields list. The list of selected objects' semantics is automatically formed according to the table connection field type. If the current table connection field is numerical – the semantics list will only contain numerical semantics. If the current table connection field is string type – the semantics list will only contain string semantics.
For Dbase databases, set the data source as "dbf file". The DB Table field should contain the full path to the database file, which can be selected using the file selection dialog button. For MS SQL Server, PostgreSQL databases, set the data source as "database". To connect to MS SQL Server database, the Data Link Properties dialog is called.
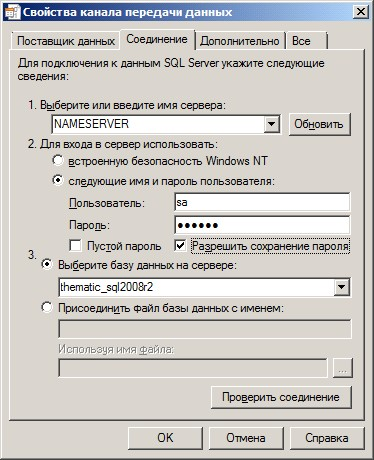
Data Link Properties Dialog The Data Provider tab is used to select the OLE DB provider. The list shows all OLE DB providers found on the disk; select Microsoft OLE DB Provider for SQL Server. Click the Next >> button and switch to the Connection tab (you can also go directly to the Connection tab by double-clicking on the provider name).
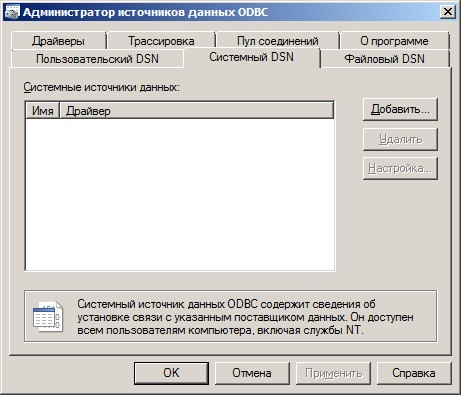
Data Link Properties Dialog Box — Connection Tab The Connection tab allows you to configure connection parameters: 1.Fill in the fields containing server name, username, and password. 2.Check the box to allow password saving and select the database on the server. 3.Click the Test Connection button to verify the connection to the specified source. 4.After successful connection testing, click OK. 5.Select a table from the DB Tables dropdown list. 6.To connect to a PostgreSQL database, you first need to create a data source using the ODBC Administrator. The executable file odbcad32.exe is located in \\Windows\\System32\\odbcad32.exe on 32-bit Windows systems. On 64-bit systems, it's in \\Windows\\SysWOW64\\odbcad32.exe. 7.Launch ODBC Administrator (Control Panel → Administrative Tools → ODBC Data Sources). 8.Activate the System DSN tab, click Add.
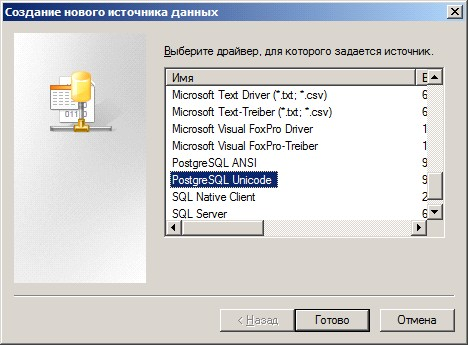
ODBC Data Source Administrator Select the PostgreSQL Unicode driver and click Finish.
Creating a New Data Source
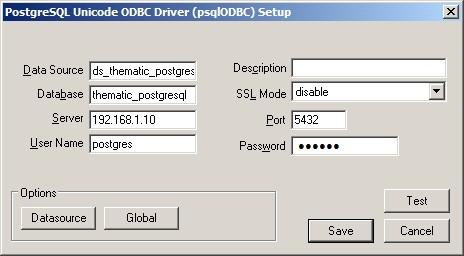
Setting Properties for the New Data Source Fill in the fields: — Data Source — name of the data source (e.g., ds_thematic_postgresql); — Database — database name (e.g., thematic_postgresql); — Server — IP address of the server computer; — Username — user name; — Password — password that will be used to connect to the database (a user with this exact username and password must be pre-created on the PostgreSQL server).
Test the database connection by clicking the Test button. Upon successful testing, complete the data source creation by clicking Save. Then, in the Build Thematic Cartograms dialog, to connect to an MS SQL Server database, the Data Link Properties dialog is called (button located to the right of the DB Tables field).
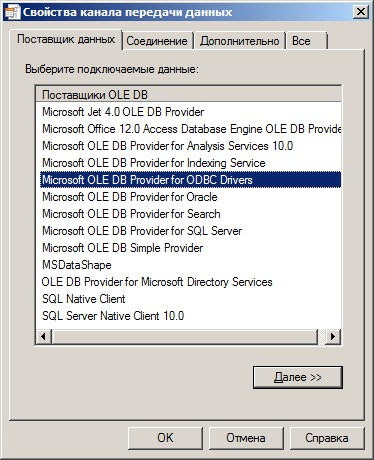
Data Link Properties Dialog Box The Data Provider tab is used to select the OLE DB provider. The list shows all OLE DB providers found on the disk; select Microsoft OLE DB Provider for ODBC Drivers. Click the Next >> button and switch to the Connection tab (you can also go directly to the Connection tab by double-clicking on the provider name). Data Link Properties Dialog Box — Connection tab.
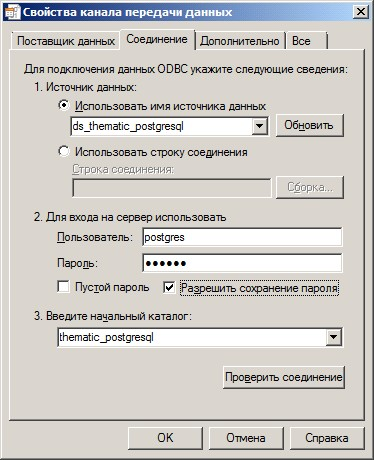
Fill in the fields containing data source name, username, password, check the box to allow password saving, and specify the initial catalog. Click the Test Connection button to verify the connection to the specified source. After successful connection testing, click OK. Then select a table from the DB Tables dropdown list.
For reading information from text files: 1.Set the Delimiter field to specify the type of separator in the text string; 2.Enable the Header option if the first line of the text file contains field names; 3.Set the encoding.
If there is no header in the text file, fields will be numbered based on the first line according to the delimiter and type will be determined (S — string, N — numeric).
4. Simple coloring (by sequence number) In this case, selected map objects are colored simply according to the order in which they are recorded on the map.
5. Simple coloring (random) In this case, selected map objects are colored in random order (the fill type for a specific object is randomly selected from the list of value intervals).
6. Coloring by object count In this case, objects (areas) are colored according to the number of selected objects in the given territory. Areas are usually administrative-territorial division objects (districts, cities, countries, etc.). The studied data can be objects from the "Public Objects" layer (pharmacies, banks, hospitals, and others). For this type of connection, objects for study must be selected on the map. Objects can be of any localization. Using the Filter button, select administrative territories for which cartograms will be built. After configuring the composition of administrative territories, statistical analysis is performed, automatically calculating interval boundary values according to the irregular range scale. The irregular range scale contains a series of 40 "round" numbers (from -10 million to 10 million).
For OpenStreetMap maps, a Theme List has been created to expedite the creation of typical thematic maps. Theme parameters are formed based on open map objects according to the map classifier. For the map5000m.rsc classifier, the theme list is contained in c:\\Users\\Public\\Documents\\Panorama\\Thematic\\map5000m.theme.
The map5000m.theme file contains three themes for configuring the Create Thematic Map dialog: — public objects in the regional territory; — public objects in the administrative district territory; — public objects in the city district territory.
Public objects are selected map objects for which statistics are calculated. Each theme has a filter for administrative territories, palette, range list, and legend settings.
7. Coloring by distance from selected objects In this case, area objects (polygons) are colored according to their distance from selected objects. Polygons for coloring are set using the Filter button. Objects for coloring can be forests, forest and urban blocks. Distance is measured from all selected map objects to the objects set in the filter. Graphics are built based on minimum distances between objects. For this mode, range boundaries are set according to the irregular range scale.
8. Coloring by unique semantic values In this mode, area objects with the same value of selected semantics are colored in the same color. Unlike other construction modes, this mode allows building for any type of semantics, including string semantics.
After executing the procedure, actual minimum and maximum values are displayed in the dialog window on the Data tab. You can change settings for Gradation, Minimum, and Interval fields on the View tab and repeat the procedure. |