Building of Voronoi diagram |


|
|
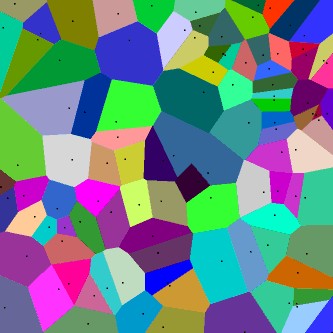
Voronoi diagram for a finite set of points S on the plane is the such partition of the plane in which each region of this partition forms a set of points that are more closer to one of the elements of S set, than to any other element of the set.
For a given set of points S the Voronoi diagram, denoted as VD (S), consists of a collection of polygons Voronoi for each of the points of set S with respect to other points in the set. Voronoi diagram divides the entire plane into convex polygons. Building a Voronoi diagram in this mode is performed using the point objects of a map. If on the map there are selected point objects, the diagram is created using the selected point objects. If on the map there are no selected point objects, the diagram is created using all point map objects. The choice of a map for drawing polygons of created diagram is carried out by using the button «…» in group Write polygones to map. Kind of new objects-polygons defined by pressing the button "..." or on the window of the displaying object in the group Kind of created polygons. The number of created polygons is equal to the number of source point objects and is displayed in the window Quantity of polygons. The area of created diagram is defined by area sizes of locating of source point objects. In Increase size (m) window of Diagram groups it is possible to set a value of increasing the area size for the created a diagram in meters. At activating the mode "Set size by map" area of the created diagram is defined by sizes of a map onto which polygons are put. In practice, the Voronoi diagram is used as a complete solution for a choice of the optimal partitioning the territory. A classic example of Voronoi diagram - a breakdown of the city into districts based on the distribution of its post offices so that each point of each district office is located just near the center of the neighborhood. Another example of using the Voronoi diagram is the study of behavior and care of living things that depend on the number of neighbors with whom they compete for food. In this case, the Voronoi diagram is the areas of habitat and the limits of the contact of living beings. However, the Voronoi diagram can be used to solve other important geometric functions: the search for the nearest neighbor, the construction of the Delaunay triangulation, finding the largest voids (circle, inscribed into a cell), to construct a minimum spanning tree, and others.
|

