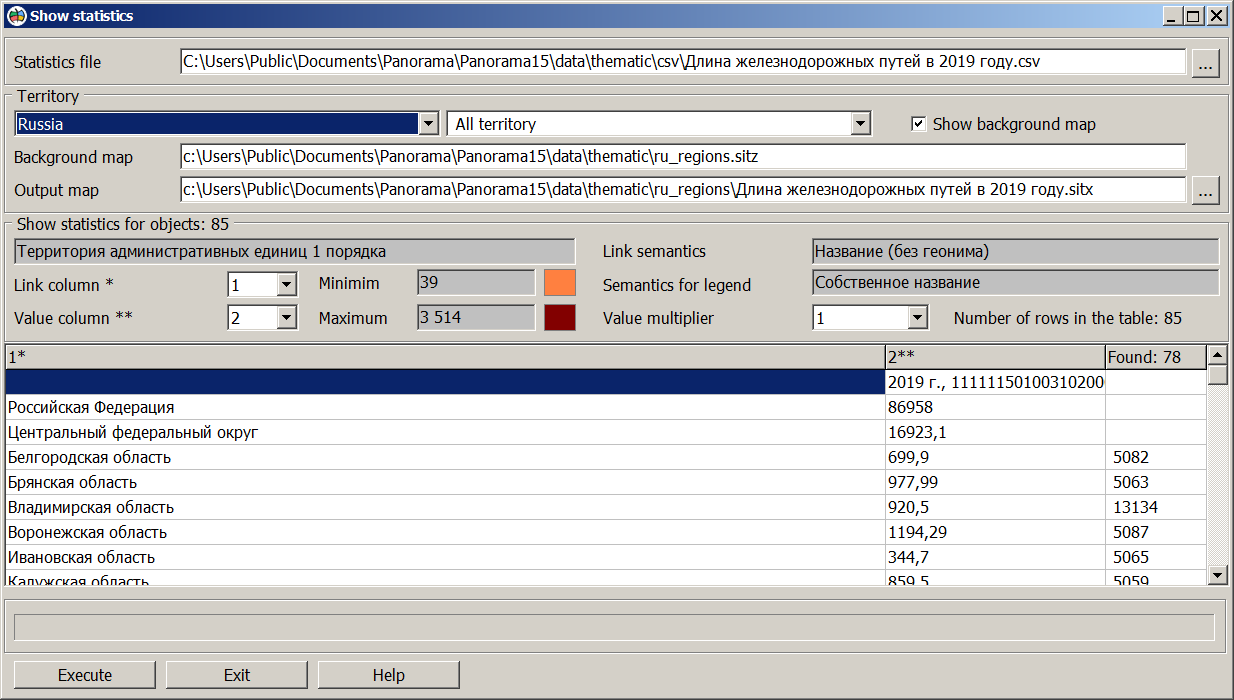
Show statistics |


|
|
The mode provides the construction of thematic maps for the countries of the world and the regions of Russia, Armenia, Azerbaijan, Belarus, Kazakhstan, India, Uzbekistan, Tajikistan and other countries based on the built-in maps of the administrative boundaries of the regions. Statistical data should be presented in the form of a table in CSV format. The table can have two or more columns, one of which is key one and must contain the names of countries, regions of countries, or municipalities that are part of the selected region.
Dialog view Show statistics Execution order
1.Select the CSV file. The examples of files downloaded from the website of the Federal State Statistics Service Rosstat, are located in the folder c:\Users\Public\Documents\Panorama\Panorama14\data\thematic\csv. 2.Select a background map. When you select a map, objects are searched for on the map by a key field (column). The number of found objects corresponding to CSV strings are displayed into the dialog. The numbers of the found objects are displayed in the last column of the table. If the number of found objects is zero, then the Execute button is inactive. 3.Click on the Execute button. The result of construction contains colored territories of administrative units, a scale of ranges of statistical data values and a list of names of territorial objects with the values of the selected statistical data
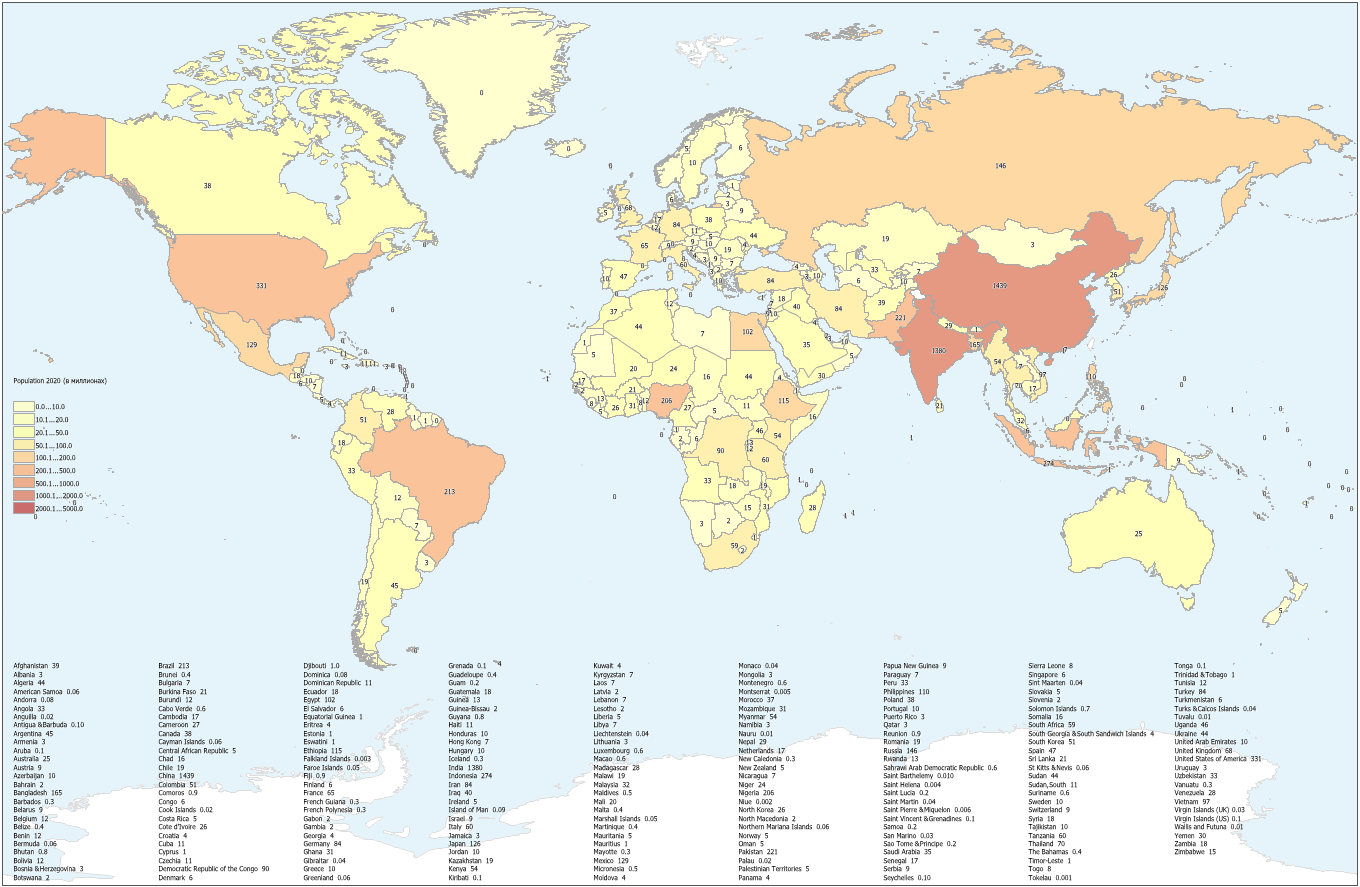
Thematic map of the World (population)
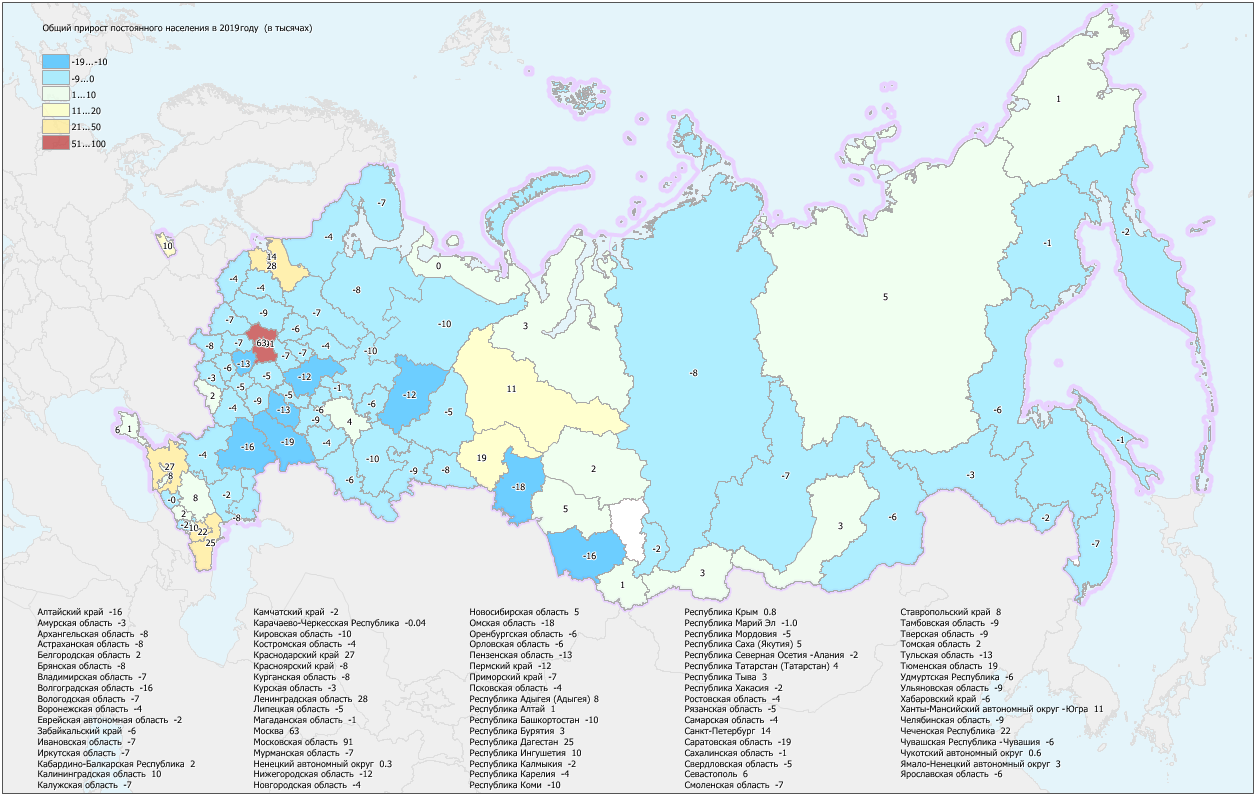
Thematic map of Russia (population growth)
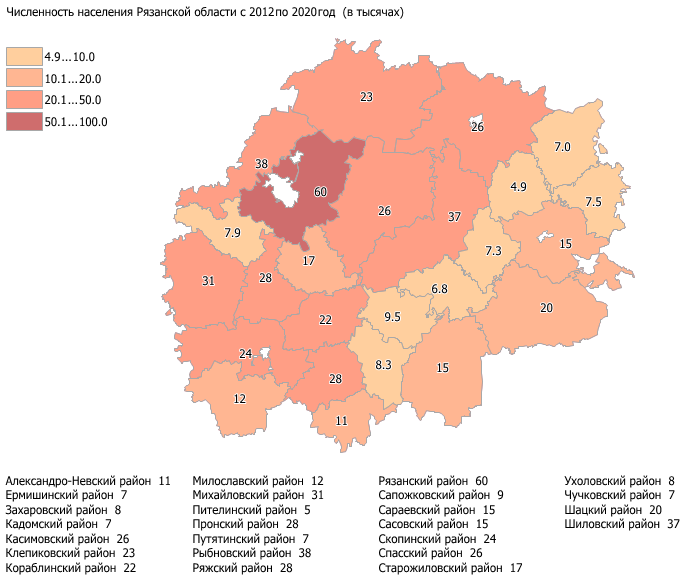
Thematic map of the Ryazan region (population)
Statistics files (* .csv or * .txt) are specified when calling the mode. You can change the file using the "…" button. The file must have a key field with the names of regions (countries, subjects or municipalities), numeric values for construction, a separator between fields (Tab, ";", ","), ANSI or UTF-8 encoding. After opening the file, an analysis is performed, as a result of which the key field, value field and range boundaries are automatically determined. The total range is divided into several parts, defining the type of the scale. The color is set for the minimum and maximum values of the characteristic used to create a thematic map. The chosen colors are saved in an ini-file, which is written to the folder containing the statistics file (*.csv).
The type of the scale depends on the range of statistical data values. With a small spread of values (with a difference between the maximum and minimum values of less than 1000 conventional units), a scale with regular ranges is formed. With a larger spread of values - a logarithmic scale. Based on a set of values, the program selects the optimal (regular or logarithmic) range of values (multiples of 2, 5, 10), selects standard divisors for displaying large values in thousands, millions and billions, calculates the accuracy of displaying small values. The value multiplier is used for reduction of the conditional values of the table to the real ones. For example, the value field can contain data on the population in millions (Russian Federation; 145.9345) - you must select the multiplier "1000000".
The table can contain a key field, several fields with values and comments. To clarify the key field, you need to change the "Link column*", or to left-click on the heading of the key column - an "*" sign will appear next to the column number, indicating the selected key field. To refine the field with values, you need to change "Value column**", or to right-click on the header of the column with values - a "**" sign will appear next to the column number. To get a better result, the key field must contain the correct names of countries, subjects, regions. A thematic map built on top of a background map is saved as a project (MPT). When the "Show background map" option is disabled, the thematic map is saved in SITX format. Examples of ready-made thematic maps (MPT files) are located in the folder: c:\Users\Public\Documents\Panorama\Panorama14\data\thematic. The resulting map can be printed or saved into files of vector (SVG, EMF) and raster (PNG, TIFF) formats.
Data requirements for creation of thematic map
The list of available background maps and building parameters are contained in the file thematic.xml (in the program folder). Background maps contain objects of administrative division: territories of countries, federal districts, subjects and municipalities. The link of the table fields with the map objects is performed by the object key (key) and the link semantics (linksem) specified in the file thematic.xml. When building a thematic map of a subject, the map is limited to the territory of the selected subject, the search is performed by municipal districts (district, see thematic.xml). The background map is formed with use of parameters of creating a map of the chosen subject (datum, see thematic.xml). The list of names in the bottom part of a thematic map is formed from semantics for the legend (namesem, see thematic.xml). Background maps of regions are located in the folder: c:\Users\Public\Documents\Panorama\Panorama14\data\thematic.
|