Browse vegetation indexes time series for object |


|
|
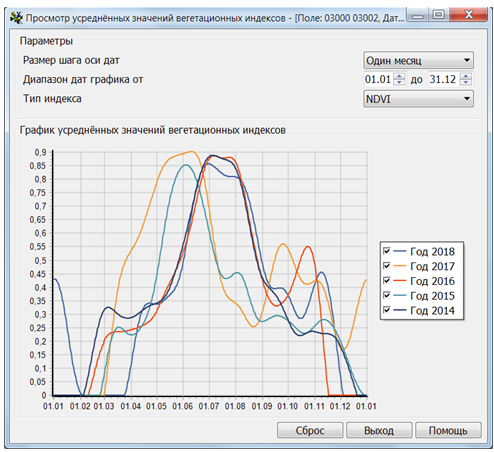
The analysis of the graph makes it possible to assess the dynamics of the development of the field biomass for different seasons. The presence of dips or peaks in some years and their absence in others may reflect the effectiveness of agronomic activities.
Dialog «Browse vegetation indexes time series for object»:
The dialog consists of parameters of displaying values and an interactive graph. The parameters specify the step along the date axis (Three days, One Week, Half a month, One month, Two months) and the display range. In the case of a small step, changes can be noticeable only on a small range, for example, one month. The graph allows you to control the choice of years for displaying data and move along the time axis in the case of a small range of dates. The Reset button returns all display options to their default state. |