Grid on a map |


|
|
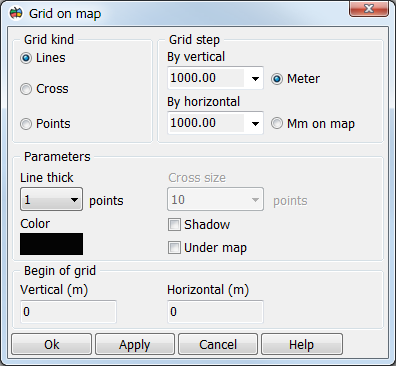
Parameters of design The grid can be represented as lines, crosses, or dots. Lines - the grid is drawn as vertical and horizontal lines of the selected color and thickness. Crosses - the grid is drawn in the form of crosses at the intersections of vertical and horizontal lines. Color, line thickness and size can be selected for crosses. Points - the grid is drawn in the form of square points at the intersections of vertical and horizontal lines. The color and line thickness can be selected for the points (determines the size of the point).
To reduce the brightness of the grid, enable the «Shadow» option and click the «Apply» button. The grid will be drawn semitransparent. The «Under map» option allows you to draw a grid under map objects.
Using the grid for object binding The grid can be used in the modes of creating, editing and moving map objects (in the Map Editor). Binding of object points and map's objects itself to grid nodes is activated by selecting the Grid node capture auxiliary mode.
Using a grid to visually assess the density of objects placement The grid can be used to visually assess the density of elevation markers placement. On a topographic map of scale 1: 100,000, the number of elevation markers should not exceed 10-12 per 1 square decimeter. To set up a grid for checking density, you must select the «Lines» grid kind and set the step to 100 mm on the map (vertically and horizontally). Then, in several squares of the grid, count the number of elevation marks located in each of the squares being checked.
|