Diagram of changes of numerical characteristics of water filling |


|
|
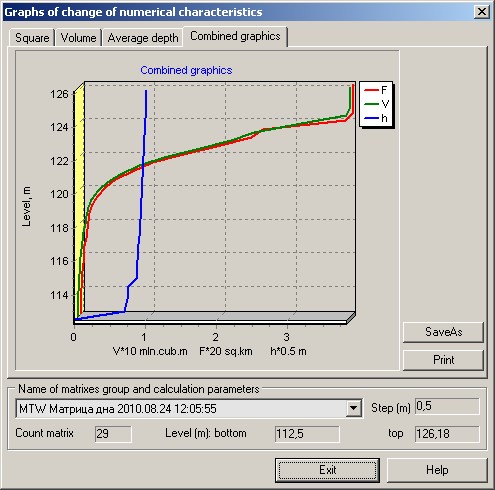
Constructing graphs of change of numerical characteristics of water filling and viewing the values of numerical characteristics is carried out by pressing the panel button the Diagram of change of numerical characteristics. Results are displayed on pages of dialog the Square, Volume, Attitude of volume to area. Each page contains a graph of change of the corresponding characteristic of water-filling depending on level of water's lifting, and also numerical values of the characteristic with indicating the levels and possibility of specifying a unit of measure. Values of the areas (squares) and volumes are taken from a database that is set in a window the Database name for results of dialog of Calculations by depths matrixes group. If results of calculations were not saved in a database then values of the areas and volumes are taken from section MTQKITCALC of map's INI-file. Calculations can be performed by various sets of matrixes of depths, and also with various step of scanning of surface, therefore for viewing and the analysis of calculations results there is a possibility to select the name of a set of results in group the Name of matrixes group and calculation parameters.
Graphs of change of numerical characteristics of water-filling:
Save as button is intended for saving graphics into formats: BMP, WMF, EMF. By pressing the button the Print after previewing the graph is printed.
|