Construction of flood zone by target method |


|
|
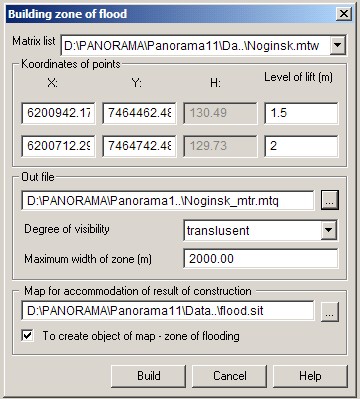
For construction of a flood zone by target method it is necessary to choose linear or polygonal object on a map and to specify points for which level of water lift is entered by pressing the left mouse button. Coordinates of the specified points are displayed in windows X, Y, H of construction's dialogue. Level of lift of water in the specified points is entered by the user.
Dialogue of building flood zone by target method:
At the used mode To create object of a map a new user map will be created with a file of resources SERVICE.RSC. The map contains a layer Objects of user which includes objects of type a Flood zone.If the user map is specified with the classifier that does not have objects such as flood zone, objects will be created with type MARKING OF AREA OBJECTS. Construction is made within the specified area of hydrography. The user selects a section of the river on the map by specifying two points for linear objects, and three - for the polygon. If it is necessary to analyse the entire river consisting of several objects of a map, or several related objects then preliminarily it is necessary to create combined object. In dialog of building flood zone it is necessary to specify a matrix of heights for which construction will be done, and relative values of lifting a water level in the points limiting the analyzed area. The program explores a slope of an analyzed area part (values of elevations in points of the part are selected from a matrix of relief); forms the targets (ranges) - segments that are perpendicular to the segments of the river's channel metric; determines the value of level of rising the water for each range, and then there are made a radially-sector evolvent of parts of a terrestrial surface between the adjacent target, building profiles of a relief in directions of evolvent and a determining the spatial coordinates of boundary points of wave propagation of passes along the lines of the evolvent. As a result, two tasks are solved: coordinates of boundary points of a flood zone are calculated and level of rising the water in each point - within the flood zone is calculated. All values are placed into a matrix of qualities (depths). At visualisation the raster component of a matrix of depths shows a flood zone. In addition to receiving the matrix of depths there is provided a possibility of creating the object that shows the borders of flood zone. |