Viewing values of matrixes in a point |


|
|
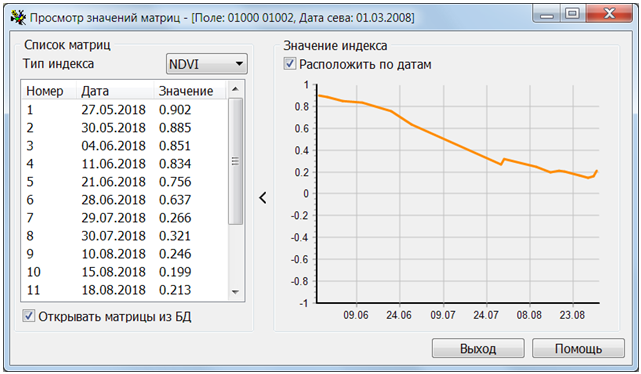
Dialog «Viewing values of matrixes in a point»:
In normal mode, the dialog consists of a drop-down list of vegetation indexes, a table of open matrixes of the chosen index for the current object, sorted by date of obtaining, and a graph of the change in the value of index at a point under the cursor by the dates of matrixes. By the button
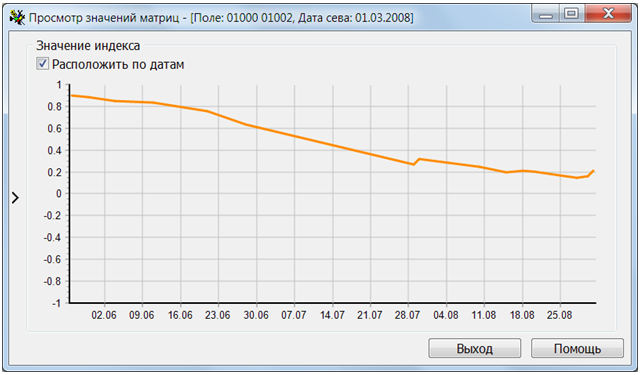
Dialog in the preview mode of the chart:
The Arrange by dates switch determines on which scale the index values will be located: by dates or evenly by numbers of matrices in the list
|